Section 4
4
The Scientific Method
The Scientific Method
At the end of this lesson you should be able to:
- Explain what is the scientific method.
- Describe the main phases of the scientific method.
- Say what physics law is.
- Say what physics theory is.
1.4.1 The Scientific Method
Scientific Method Phases
The progress in the development of the physical sciences has been of such significance that the difference between physics and other sciences such as chemistry, biology and astronomy seem to be indistinguishable.
Furthermore, other sciences such as psychology, linguistics, sociology, etc. seem to want to adopt the scientific method used by the exact sciences. For this reason it is worth mentioning in this place and in some detail what the scientific method consists of.
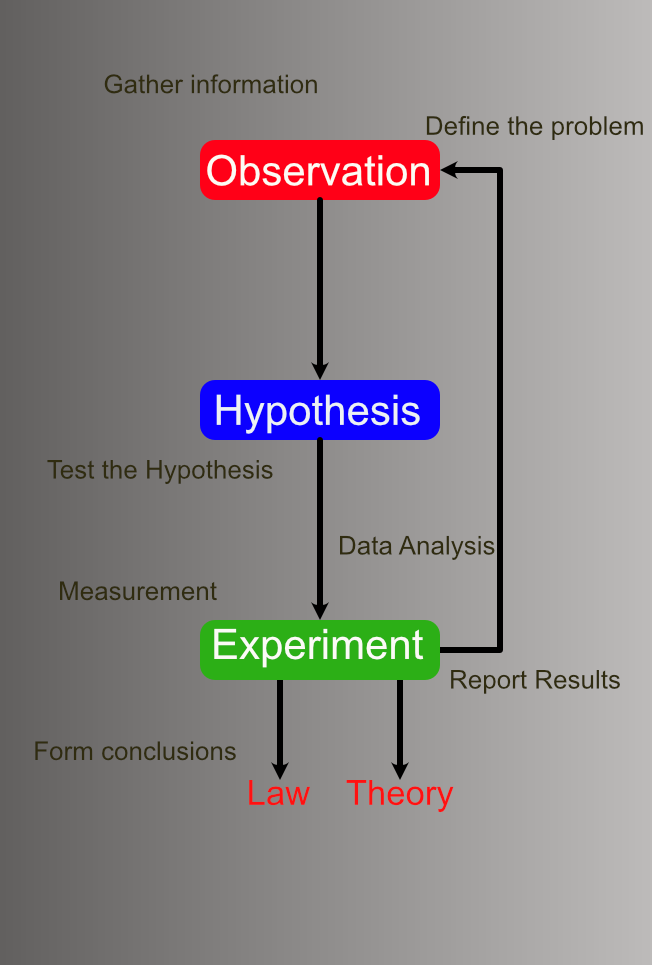
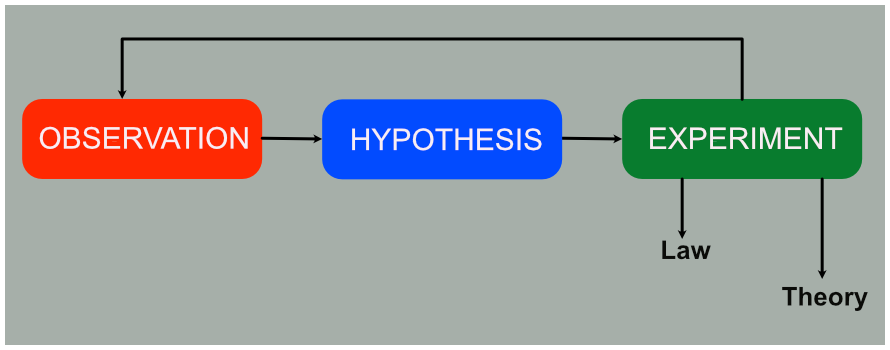
The scientific method is essentially composed of three feedback phases as seen in figure 1.4.1.
The first phase consists of the observation of some phenomenon that we are interested in explaining. Clearly identify which property of the phenomenon interests us. We are in the process of identifying the problem. At this stage, it is extremely useful to identify, through logical reasoning or an experimental procedure, which properties vary and cause the phenomena to vary. These varying properties are called variables.
The observation can be qualitative or quantitative. An example of a qualitative observation is to say that the temperature is lower the higher we go up a mountain. Quantitative observations are measurements that are expressed with a number and a unit. For example, we can affirm that the boiling point of water in Medellín, which is 1,500 m above sea level, is 95 ºC. In this case the temperature is a variable and changes with the altitud, another variable, called control variable, because it can be changed at will.
The second stage tries to give an explanation of the observed facts formulating a hypothesis. For example, we could formulate the hypothesis that the boiling temperature of water depends, even more, it decreases with height above sea level. It should be clear that the formulated hypotheses must be the result of previously acquired information or the genius of the researcher. The hypothesis is an educated guess. This is what I meant when I said that the stages are in a feedback arrangement.
The third stage, and perhaps the most decisive, consists of reproducing the observed phenomenon in a controlled manner at the whim of the experimenter. So the experiment is a process executed on the object to be observed or observable property. Several systems are involved in the process to produce data. The systems involved are: the experimenter, the measuring instrument and the environment. The process must be planned in such a way that the measurement results are as reliable as possible. Section 5 addresses some aspects of the measurement process.
The result of the experiment is the last word about the truth or falsehood of the formulated hypotheses. For example, we could measure the boiling temperature in Cartagena, which is at sea level, and measure it in Rionegro, Antioquia, which is at 2,100 m above sea level. This is the way to get physical laws, or models of reality that describe what happens. However, we could try to explain why this happens, and thus we would obtain a physical theory.
As a result of the aforementioned process, it can be said that there is a very special relationship between physics, mathematics (modeling) and laboratory experimentation. For a good understanding of the fundamental laws of mechanics that are the objective of this course, very good knowledge of the following areas is necessary: arithmetic, geometry, trigonometry, algebra, vector algebra, differential calculus, and integral calculus.
Parallel to this course, a laboratory course must be carried out, which aims to support the theoretical course and also train the student to document experimental information and present it adequately.
Fall time of heavy and light spheres
To illustrate the method, let us repeat something similar to the experiment performed by Galileo in order to measure the time t it takes for a sphere to roll without friction a distance d on an inclined plane.
How will the mass m of the sphere affect the time t it takes to travel the distance d ?
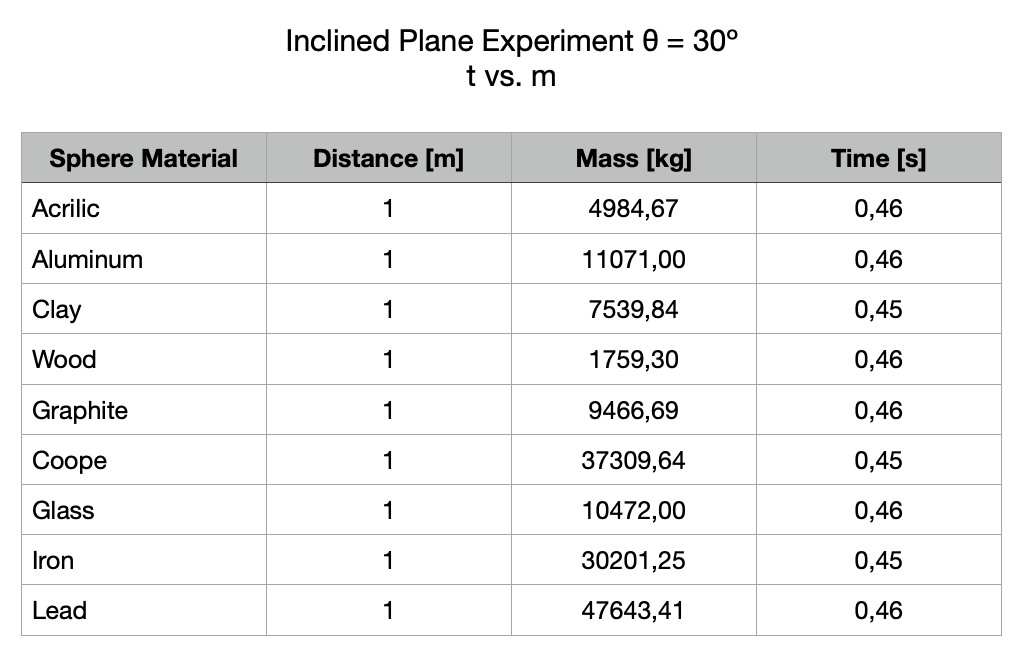
Observation: First of all it is necessary to assume that there is no friction between the surface of the plane and the spheres. We also set the inclination of the plane to θ = 30º. We keep the size of the sphere constant. All spheres are 1 cm = 10-2 m in diameter. The material of the spheres is different and consequently their mass and weight are different.
Hypothesis: Observations seem to suggest that the time t to travel 1 m down the plane is the same.
Experiment: For the experiment we prepare an inclined plane of one meter in length and precision ±1mm and we reduce the friction forces by lubricating it. The plane is placed forming an angle of θ = 30º with the horizontal. The lubricated spheres of different materials are prepared and weighed with a precision digital scale ± 1gr. Time was measured with a precision stopwatch ± 0.01s.
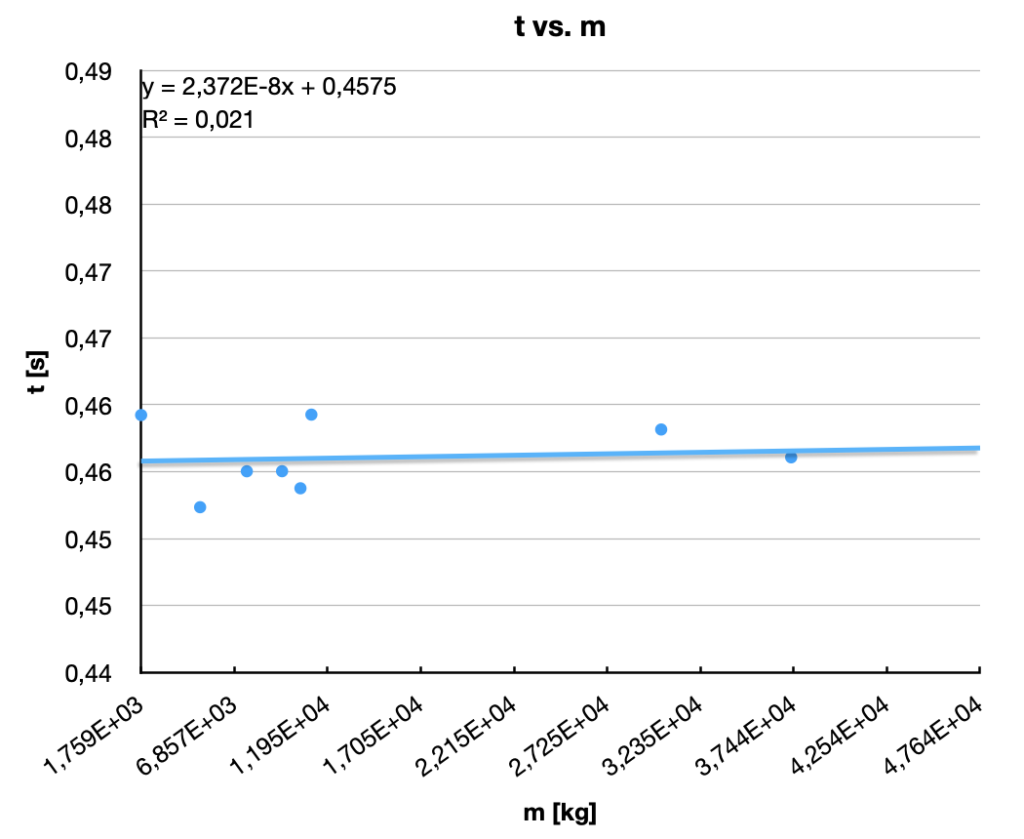
Experiment data are shown in table 4.1 and its graphical representation in figure 1.4.2. As can be seen from the graph, the travel time is independent of the mass, R2 very close to zero. All masses take the same amount of time, 0,458 s to travel.
Determine how d vs t of an object rolling down an inclined plane
As in the previous example, we must analyze which are the variables of the experiment. We must decide which ones we are going to keep constant. The variables of the experiment are: the mass of the particle under observation, the interaction between the particle and the inclined plane, the inclination of the plane, the distance traveled by the particle and the time required to travel it. These are the assumptions:
Particle mass: 1.006•10-3 kg.
Friction: zero.
Tilt angle: θ = 30º.
Time t: independent variable.
Distance d: dependent variable.
The distances on the inclined plane were measured with a 1 mm precision ruler and marked on the surface. Time was measured with a 0.01 s precision stopwatch.
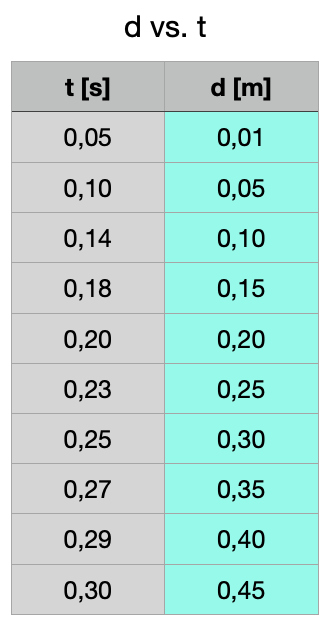
Experiment data and its graphic representation are presented in table 1.4.2 and figure 1.4.3.
Simulation 1.4.1. Animation of a sphere rolling down a 30º inclined plane.
The collected and interpreted data.
Scientific Method Examples
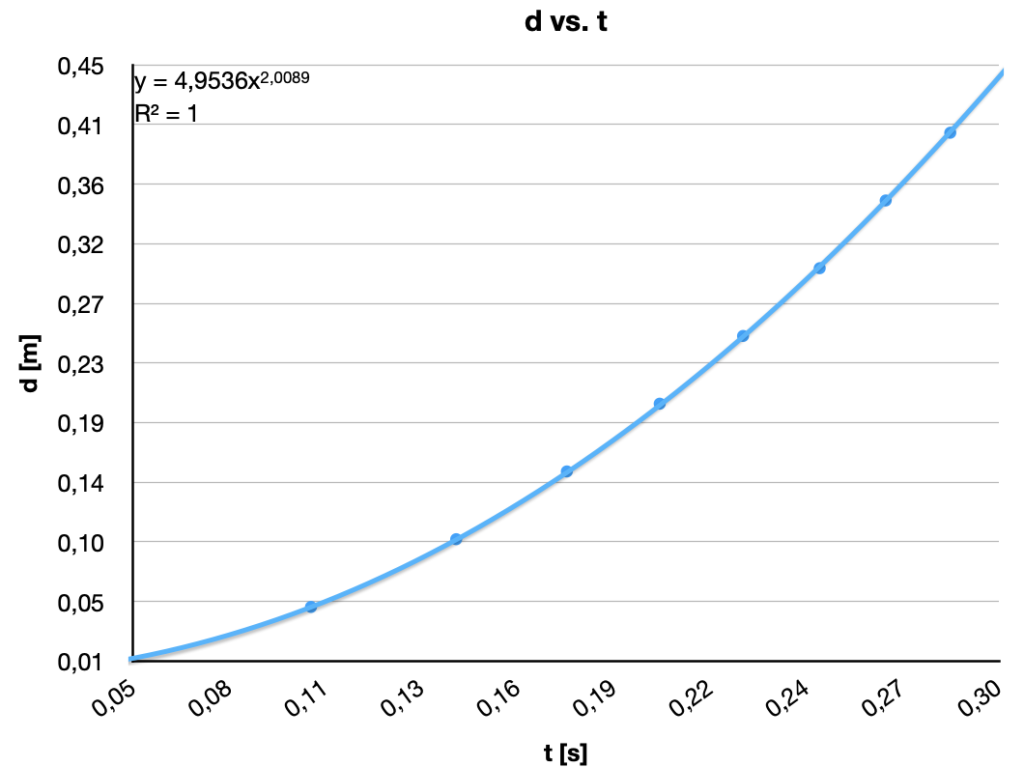
Graph of the relationship d vs. t, found from the experimental data.
R2 = 1 says that the data fit is excellent. Note that increases with t2. The coefficient of the quadratic equation, 4,95 , is close to half of gravity 9,8 / 2 = 4,90.